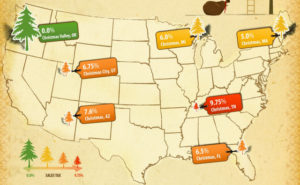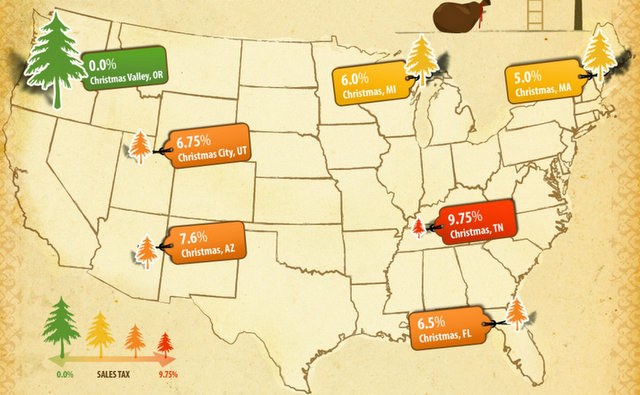
Map excerpted from http://visual.ly/o-christmas-tree-how-whacky-are-your-taxes from infographic created by www.avalara.com
We searched the web for fun holiday maps and in our browsing stumbled upon the Christmas stream of infographics from Visual.ly. Full of data visualizations, these maps in particular caught our eye: O Christmas Tree: How Wacky Are Your Taxes (photo above), How to Say Merry Christmas & Santa Claus in Other Countries, and Christmas Dinner Across the World.
And here’s one more story map to ring in the holiday cheer from Esri Italia.
We wish you a safe and happy holiday season & look forward to sharing more resources with you in the new year!
At GISetc.com we curate and bring you the best geography and science resources from the web. We hope our sharing will keep you up to date on the latest science and geospatial news.


