info@GISetc.com
  • Facebook
  • Twitter
  • Facebook
  • Twitter
0 Items
GISetc
  • Home
  • About
  • Blog
  • Resources
  • Services
    • Services and Pricing
    • Get a Quote
  • Shop
Select Page

Interactive Map of Urban Growth

by gisetc | Nov 29, 2011 | Free Resources, Our Blog | 0 comments

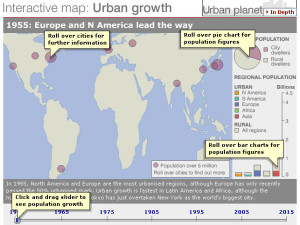
This interactive map from the BBC showing urban growth across the planet uses the Gall-Peters projection.

All flat rectangular maps of the Earth contain some distortion of land size, shape and distance between countries. The Peters Projection minimises the distortion to land area, enabling the best comparison between regional populations and the size of the land masses they live on.

Looking for something?

On the blog

  • Cool Cloud Tools We Learned about at Esri UC 2020
  • Esri 2020 Virtual Conference
  • GeoEd ’19
  • 2019 Texas Student Map Competion
  • Summer 2019 GeoTech Center Workshops


Copyright GISetc, a division of Critical Think, Inc 2021


Product categories

  • Facebook
  • Twitter

Designed by Elegant Themes | Powered by WordPress