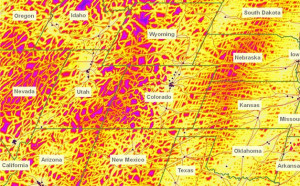
 This resource was pointed out to us by our friend, Joseph Kerski. The data in the article he recommended is downloadable and quite fascinating – enjoy!
Examining the Spatial Pattern of Travel Time To Major Cities (courtesy of ESRI)
Have you ever wanted to get away from it all? Recent research by the European Commission and the World Bank on travel time to major cities of the world yields fascinating patterns when used in a GIS environment. The resulting map shows “out of the way” places—far from cities of 50,000 or more people.
Use this data to explore remoteness (according to the data, only 10% of the land area is remote in terms of being more than 48 hours from a large city) and density (95% of the people live on 10% of the land). Discuss the concept of accessibility—economic, physical, and social, manifested in access to markets, schools, hospitals, energy, or water. How is accessibility a precondition for the satisfaction of needs? Consider accessibility from the scale of local development to global trade.
As with any map, you should examine how and why it was made. The website describes the spatial data layers and cost-distance model used to create it. The model not only includes cities, but also roads, railways, shipping lanes, national boundaries, slope, elevation, land cover, water bodies, and rivers in calculating how fast one could move over the Earth’s surface.
