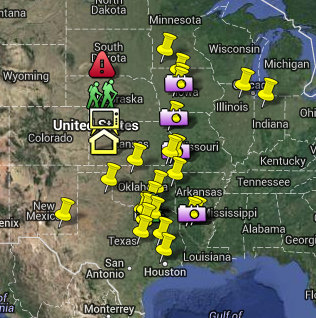
Excerpted picture from MyReadingMapped.blogspot.com. Follow the link in the article to interact with the original map.
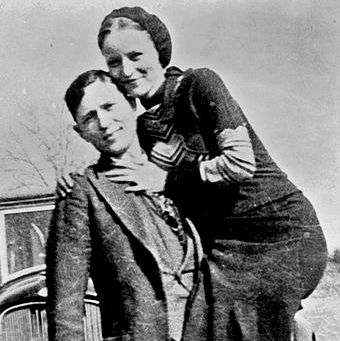
If you’re like us, you tuned in to watch the big Bonnie & Clyde mini series across multiple cable channels last weekend (or it’s sitting on your DVR waiting for your “free time”). Even Project Runway jumped on the Bonnie & Clyde bandwagon with a design challenge based on the 30’s.
Use this surge of pop culture awareness to start a conversation with your students. While we were expolring the web, swept up with Bonnie & Clyde mania, we discovered a fabulous interactive map made by MyReadingMapped that chronicles the duo’s crime spree from 1032-34. Explore it with your students and show them another way GIS can bring history to life and add context to the stories they read or movies they watch.
At GISetc.com we curate and bring you the best geography and science resources from the web. We hope our sharing will keep you up to date on the latest science and geospatial news.


The MyReadingMapped map of the activities of Bonnie and Clyde that this article mentions has been moved to http://climateviewer.org/index.html?layersOn=mrm-55