Social media maps are a tool that can instantly connect your students to trends in current events. By leveraging them you give them an identifiable context for news as it’s happening in their world. Below is an intro to an excellent, in-depth tutorial on creating your own social media maps for your classroom by Bern Szukalski and Carla Wheeler.
Maps that embed social media, such as photos, videos, or short messages, are quickly emerging as a new medium for keeping people informed about the location of and news related to hurricanes, wildfires, earthquakes, or other natural disasters.
These social media maps can also keep us updated as to what’s happening on the ground during political upheavals or humanitarian crises. For example, Esri recently created this Horn of Africa Drought Crisis map to share information about the dire shortage of water and food in countries such as Somalia and Eritrea.
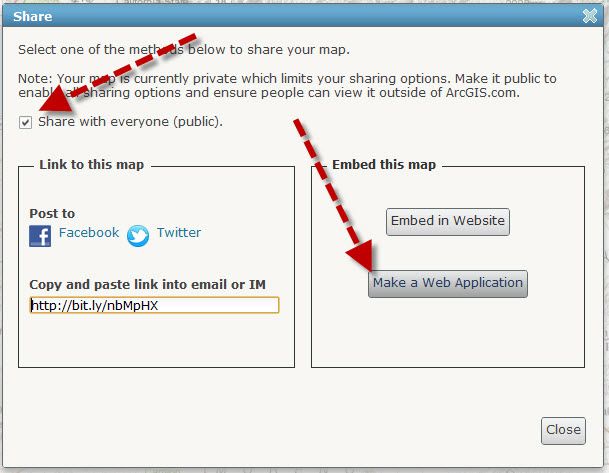
You also can create your own social media map to find out what people are saying about an event. You can take any ArcGIS Online map, add geolocated Tweets, and share your map with others in five quick, easy steps.”
At GISetc.com we curate and bring you the best geography and science resources from the web. We hope our sharing will keep you up to date on the latest science and geospatial news. Click here to view the full article in its original format and learn how to build your own social media maps, from ESRI News.

